Bringing information you can use for action about herbicides, pesticides and other toxic chemicals in northern California and around our shared world
PDF Version
Click here for a 112 kb pdf version of the original file
CATs at Work
Our Shared World
Online Store

Programs


Humboldt Bay Listing As Dioxin-Contaminated Endorsed by CATs
February 26,2007
NorthCoast Regional Water Quality Control Board
Attn: Bruce Gwynne
5550 Skylane Blvd., Suite A
Santa Rosa , CA 95403
By electronic mail: bgwynne@waterboards.ca.gov
Response to: SOLICITATION OF WATER QUALITY DATA AND INFORMATION FOR 2008 INTEGRATED REPORT - LIST OF IMPAIRED WATERS AND SURFACE WATER QUALITY ASSESSMENT [303(d)/305(b)]
Dear Mr Gwynne,
Humboldt Bay is impaired with dioxin and TEQ (2,3,7,8-TCDD Equivalent). There is no denying this impairment, though all sides in any argument about its 303(d) listing wish it werent so. But it is, and it is time to get on with identifying sources of dioxin and ways to eliminate or vastly reduce those sources.
PCB (Polychlorinated byphenyl)
G1. What are dioxins?
"Dioxins" refers to a group of chemical compounds that share certain chemical structures and biological characteristics. Several hundred of these compounds exist and are members of three closely related families: the chlorinated dibenzo-p-dioxins (CDDs), chlorinated dibenzofurans (CDFs) and certain polychlorinated biphenyls (PCBs). Sometimes the term dioxin is also used to refer to the most studied and one of the most toxic dioxins, 2,3,7,8-tetrachlorodibenzo-p-dioxin (TCDD). CDDs and CDFs are not created intentionally, but are produced inadvertently by a number of human activities. Natural processes also produce CDDs and CDFs. PCBs are manufactured products, but they are no longer produced in the United States.
From: National Food Safety Program. 2002, Updated 2006.Questions and Answers about Dioxins U. S. Department of Health and Human Services, U. S. Department of Agriculture, U. S. Department of Veterans Affairs,U. S. Environmental Protection Agency,U. S. Department of Defense, U. S. Department of State. http://www.cfsan.fda.gov/~lrd/dioxinqa.html#g1
Humboldt Bay is already listed as impaired for PCBs. The TEQ (toxic equivalency of a dioxin or dioxin-like compound relative to 2,3,7,8 TCDD) for PCB are not part of the data sets currently under consideration, i.e. PCB was previously found in tissue of organisms that live in Humboldt Bay and, in separate measurements that did not include PCBs, dioxins have been found in the tissue of organisms that live in Humboldt Bay. As yet, no one has conducted tests that take into consideration the presence of both PCB and dioxin in tissue samples or analyzed the symbiosis or magnification that would result. This factor adds further emphasis to the need to keep the Bay listed as impaired for dioxin, since the health effects (to both humans and wildlife) caused by dioxin itself is exacerbated by the same effects caused by the dioxin-like PCBs.
To further identify dioxin-like PCBs, please see National Academy Sciences (NAS). 2003. Exposure and Human Health Reassessment of 2,3,7,8-Tetrachlorodibenzo-p-Dioxin (TCDD) and Related Compounds Review Draft Part I: Estimating Exposure to Dioxin-Like Compounds Volume 1: Sources of Dioxin-Like Compounds in the United States. http://www.epa.gov/ncea/pdfs/dioxin/nas-review/ Chapter 11. Sources of Dioxin-like PCBs.http://www.epa.gov/ncea/pdfs/dioxin/nas-review/pdfs/part1_vol1/dioxin_pt1_vol1_ch11_dec2003.pdf
According to a recent study of the effect of PCP contamination of fish tissue, people eating fish caught in Humboldt Bay may be at greatest risk to exposure to PCBs and dioxins:
Polychlorinated biphenyls (PCB) are the second greatest cause of fish advisories, and are often the greatest contributors to dioxin-like toxic equivalency (TEQ) in fish and seafood. Because fish consumption is associated with both contaminant risks and health benefits, incremental health risks from PCBs in fish should be considered within the context of overall TEQ associated dietary risk to enable consumers to make informed decisions about choosing to eat fish or alternate foodstuffs. In this paper, potential TEQ exposure from PCBs in fish for adults with a variety of consumption patterns and consuming fish from a variety of sources are calculated using recent consumption and fish contaminant data from the literature and compared to total TEQ exposure from all sources. For high-level consumers and individuals eating fish from relatively contaminated sites, PCB TEQ exposure from fish consumption alone may exceed the 1 pg TEQ/kg/day average adult daily intake estimated by EPA, which itself carries an upper bound cancer risk of 1 in 1000. PCB TEQ risk for average consumers of commercial fish is expected to be far less, but is highly uncertain, since there is a dearth of congener specific PCB data for commercial fish and seafood.
Judd N,* Griffith WC,* Faustman EM. Regul Toxicol Pharmacol. 2004 Oct;40(2):125-35. Contribution of PCB exposure from fish consumption to total dioxin-like dietary exposure.
Sources of dioxin in Humboldt Bay:
Data based on numeric information is important for establishing that a water body is or is not meeting, or not likely to meet, existing water quality standards is critical to establishing or refuting a 303(d) listing. Equally important is documented information of conditions known or regarded as probable sources of dioxin to the water body coupled with information about the presence of these sources that show existing water quality standards are not likely to be met. Both data and information exist to support the 303(d) listing of Humboldt Bay as dioxin impaired.
In Baykeepers petition to list Humboldt Bay as impaired by dioxin, the case was made based on comparison of the listing of San Francisco Bay for dioxin impairment.
An analysis of the sources of dioxin and dioxin-like compounds in Humboldt Bay is similar yet far simpler than that for San Francisco Bay. The latter is a complex industrial area with many potential legacy and current activity sources that may be discharging dioxin. In addition, San Francisco Bay and its watershed is much larger than Humboldt Bay and its watershed. A review of The Inventory of Sources of Dioxin in the United States cited below indicates that most know contributors of dioxin to the environment that may exist in the San Francisco Bay watershed do not exist in the Humboldt Bay watershed. Two of the largest quantified sources in the Inventory are backyard trash burning and landfill fires, sources that may have contributed to dioxin loads in Humboldt Bay in the past, but have been banned in recent years and are not a currently contributing sources. It is widely recognized that current sources are those of concern.
The major current contributors of dioxin to Humboldt Bay are most likely to be reservoir sources, defined in the previously cited Sources of Dioxin-Like Compounds in the United States. http://www.epa.gov/ncea/pdfs/dioxin/nas-review/, in this case we cite Chapter 12, Reservoir Sources of CDDss/CDFs and Dioxin-like PCBs: Sources of Dioxin-Like Compounds in the United States:
Reservoirs are materials or places that contain previously formed CDD/CDFs or dioxin-like PCBs and have the potential for redistribution and circulation of these compounds into the environment. Potential reservoirs include soils, sediments, biota, water and some anthropogenic materials. Reservoirs become sources when they have releases of dioxin-like compounds to the circulating environment over a defined time and space. Like other sources they would not include purely intermediate products or materials properly disposed in a secure landfill. Reservoir sources are not included in the quantitative inventory of contemporary sources because they do not involve original releases, but rather the recirculation of past releases. They can, however, contribute to human exposure and, therefore, are important to consider.
This dynamic system consists of fluxes in and out of the atmosphere, as well as other exchanges between reservoirs and the atmosphere. Movement between media can be induced by volatilization, wet and dry atmospheric particle and vapor deposition, adsorption, erosion and runoff, resuspension of soils into air, and resuspension of sediments into water. The rate of movement from one environmental medium to another is termed flux, and refers to the direction and magnitude of flow and exchange over a reference time period and space.
Reservoir sites contributing dioxin to Humboldt Bay are as follows:
Lumber mill sites where dioxin-contaminated pentachlorophenol was used extensively and with little regard for environmental contamination between 1950 and 1985 and which continue to discharge penta and dioxin into the Bay due to the persistence particularly of dioxin.
In California, PCP has been used extensively for wood preservation at lumber mills and wood treatment plants. From: Palmer, F et al. State Water Resources Control Board. March 1988. Report No. 88-5WQ Division of Water Quality. Chlorinated Dibenzo-p-dioxin and Dibenzofuran Contamination in California from Chlorophenol Wood Preservative Use. (This reference forms the basis of much of the assessment offered below)
From the above citation Point Sources, page B.5, the sources of dioxins rated High for California are municipal waste incinerators, PCP sludge incinerators and sawmills.
In several verbal communications with Frank Reichmuth, Bill Rodriguez and other Regional Board staff that occurred from 1988 to 1992, I learned that NCRWQCB staff had traveled to the North coast to investigate the use of pentachlorophenol at sawmills. This interest and subsequent investigation was initiated as a result of a devastating fish kill that occurred on the Mad River in 1967. Discharge of pentachlorophenol from the MacNamara and Peepe Mill on Glendale Drive just off 299 east of Arcata in Glendale had contaminated the stream running through the property and into the Mad River. 30,000 fish died in one day, and fish continued to die for weeks. The incident awakened the newly formed North Coast Regional Water Quality Control Board to a serious problem in its district: The application of pentachlorophenol to preserve wood in saw mills throughout the region.
In the late 1980s, Bill Rodriguez related to me anecdotal stories of his investigation of sawmills, of outright denial (a mill manager in Hoopa denied using penta just as a tanker truck full of the chemical pulled into the loading bay) and ignorance (Eel River sawmill workers dressed in full rain gear in an attempt to prevent exposures to their skin in a green-chain bathtub penta dip tank) in sawmills he and other Regional Board staff investigated.
A report submitted to the Regional Board in 1988 summarized what little staff had been able to learn in visits to closed mills and some that were then currently operating. (See Status Report on Problems of Disposal of Pentachlorophenol Wastes from the Timber Industry, Frank Reichmuth, Albert L. Wellman, North Coast Regional Water Quality Control Board, September 28, 1988.)
A few former and current sawmill sites located on the Humboldt Bay have been subject to regional water board oversight for penta and dioxin contamination. These include: Beaver Lumber Company; Schmidbauer Lumber Company, Arcata and Eureka; Sierra-Pacific Industry, Arcata; and Simpson Timber Company, Fairhaven and Arcata.
One of the sawmills investigated by the Regional Board staff, Simpsons Arcata plant, was not indicated to have used penta in the 1988 report referenced above. I have testified and documented to the Department of Toxic Substances Control why this occurred: Because Simpson denied ever using penta on three separate occasions to three agencies. These included Regional Board staff, later to the Department of Health Services during a site investigation in 1990 by its epidemiologists to establish why four former workers at the plant had contracted rare blood cancers, and to the Department of Toxic Substances Control during its investigation of contamination at the mill in 1996. It does not seem a far leap to speculate that Simpson denied using penta because the company did not want to admit how it had disposed of penta residues, which was later exposed as by dumping the material in a hole in the ground behind the mill, then later covering the hole with a lunchroom for workers. Other sawmills likely did not want to get into trouble with the regulatory agencies and so did not report past use of penta.
Another reason Regional Board staff did not compile an accurate list of penta-contaminated sawmill sites is because many mills had closed by the time of the investigation and no one stepped forward to provide information about past use of penta at these sites.
Nevertheless, Regional Board could, and should, now undertake a serious investigation of former sawmill sites based on several indicators of historic penta use. These include the size of the mill (volume of wood and number of employees) since known sites were larger, more affluent mills; the type of wood milled, with penta more frequently applied to Douglas fir since redwood is perceived as self-preserving; and the type of milling process used, for example remanufacture to fence posts such as was done at Simpsons Arcata mill.
In 2002 I produced a map entitled Pentachlorophenol (PCP) Sites on Humboldt Bay: Forgotten But Not Gone, based on anecdotal information I have gathered over the years and my assessment of probable sites of significant contamination. The latter is based on two documents: Lumber and Forest Products Plants of Humboldt County. Compiled by: Eureka and Humboldt County Chambers of Commerce with the cooperation of: California Division of Forestry, Fortuna, Calif. and Humboldt County Assessor, July, 1956 and Directory of Lumber and forest Products Plants in Humboldt County, California. Compiled by the Greater Eureka Chamber of Commerce. May 1965. I have attached this map to these comments.
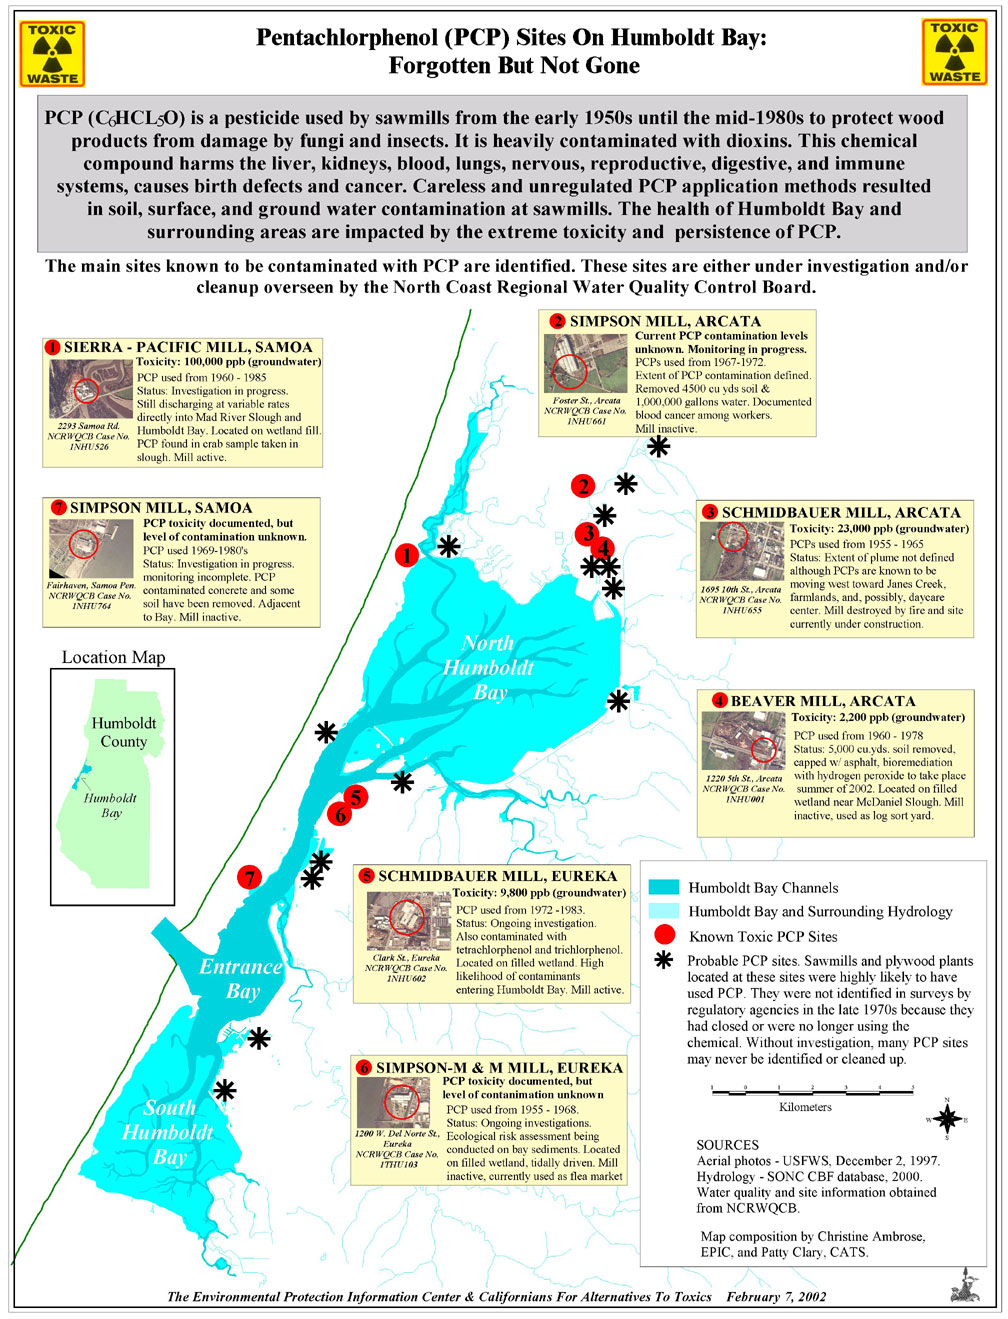
Since the above referenced map is a little vague regarding the exact locations of former sawmills that can reasonably be inferred to be contributing dioxin to the bay (due to size and other factors plus proximity to Humboldt Bay and/or streams that flow into the Bay) and which have not been investigated, below is a list describing the name and location of suspect mill sites (not all locations are described in the Chamber of Commerce reports but can be obtained by other means):
From the 1956 directory:
1. All-Bright Lumber Company; remanufacture, etc; Douglas fir; 60 employees, 300M board feet daily Foot of I Street, Arcata
2. Arcata Redwood, Arcata (Bra-Cut?) less than 100 employees and 150 M board feet daily.
3. Bay Lumber Company, Foot of Washington Street, Eureka; 40 employees; 80M board feet daily.
4. Big Tree Timber Company, Fairhaven; Sawmill, unknown employees and daily production.
5. Brightwood Lumber Company, Samoa Rd, 2 1/2 miles W. of Arcata; 22 employees (80 employees reported in the 1965 directory); 75M board feet daily (200M board feet daily reported 1965)
6. Cheadle Brothers, End of Vigo St., Eureka; 12 employees; 45M board feet daily. Cheney Brand Lumber Company, Arcata; 27 employees; 80M board feet daily.
7. D & M Lumber Company, Graham Road, Bayside;18 employees, 90M board feet daily.
8. A.C. Dutton Lumber Company, Foot of Washington Street, Eureka; 160 employees; 130M board feet daily.
9. Dl Dorado Lumber Company, Alliance Road, west of Arcata; 26 employees; 40M board feet daily.
10. Eureka Lumber & Crossarm Company, Vigo Street, Eureka; 50 employees; 160M board feet daily.
11. Eureka Redwood Lumber Company, Foot of M Street, Eureka; 50 employees, 160M board feet daily.
12. Hammond Lumber Company, Samoa; remanufacture; 580 employees; 180M board feet daily.
13. Hammond Lumber Company, Eureka; remanufacture; 230 employees; 180M board feet daily.
14. Holmes-Douglas Lumber Company, Janes Creek area, Arcata; remanufacture; 11 employees; 90M board feet daily.
15. Holmes Eureka Lumber Company, Bucksport, Eureka; 320 employees; 160M board feet daily.
16. Keith, Gaylord Lumber Company, 803 Pine Street, Eureka; 9 employees; 16M board feet daily.
17. Precision Lumber Company, Bayside; 70 employees; 200M board feet daily.
18. Roddiscraft, Inc, Arcata; 60 employees; 110M board feet daily.
19. Archie Smith Lumber Company, Alliance Road, Arcata; 30 employees; 30M board feet daily.
20, Sound Lumber Co, Arcata; Douglas fir sawmill; 95 employees; 140< board feet daily.
21. G.L.Speier; Twin Parks Addition, Arcata; 25M board feet daily.
22. Starwein Lumber Company, 2237 G Street, Eureka; 25 employees; 40M board feet daily.
23. Starwein Lumber Company, Eureka; 40M board feet daily.
24. Trio Lumber Company, R.R. Avenue, Fields Landing; 14 employees; 50M board feet daily.
25. Eureka Lumber Co., 3rd at Commercial St., Eureka; Remanufacture; 10 employees; 40M board feet daily.
26. Lane Portland Lumber Co., Arcata; Remanufacture; 20 employees; 75M board feet daily.
27. Peters Lumber Co., on Alex Christie Property Janes School District, Arcata; 17 employees; 130M board feet daily.
28. Roddiscraft, Inc., Arcata; Planning; 14 employees; 100M board feet daily.
29. Van De Nor Lumber Co., Arcata; Resaw; 19 employees; 65M board feet daily.
30. Wes-Cal Lumber Co., South Arcata; 25 employees; 200M board feet daily.
31. Arcata Plywood Corp., Arcata; Plywood; 235 employees; 180M board feet daily.
32. Eureka Plywood, Foot of Murray St., Eureka; Plywood; 320 employees; 200M board feet daily.
33. Mutual Plywood Corp., Fairhaven; Plywood; 400 employees; 370M board feet daily.
34. Fairhaven Lumber Co., North Fairhaven; 6 employees; 40M board feet daily.
35. George S. Koch Lumber Co., Eureka; Tie; 12 employees; 35M board feet daily.
36. Pacific Studs, Inc., Arcata; Fir; 42 employees; 75M board feet daily.
37. Cheney Redwood, Inc., Arcata; Ties; 35 employees; 100M board feet daily.
38. Davis Fir Mills, Foot of 10th St., Arcata; 75 employees; 140M board feet daily.
39. Georgia-Pacific Corp., Samoa; 1025 employees; 825M board feet daily.
40. Lane Portland Lbr. Co., Bra-Cut; 30 employees; 200M board feet daily.
41. Frank W. McAlister, Bra-Cut; 15 employees; 20M board feet daily.
42. Park Corporation, 2nd & M Sts., Eureka; Remanufacture; 50 employees; 200M board feet daily.
43. Peavey Lumber co., Alder grove Rd,. Arcata; Fence Posts, Fir; 35 employees; 75M board feet daily.
44. Tidewater Mills, Inc., Foot of Washington St., Eureka; 140 employees; 200M board feet daily.
45. Twin Parks Lbr. Co., Sunset Addition, Arcata; 60 employees; 70M board feet daily.
46. U.S. Plywood Corp., Fairhaven; Douglas Fir; 338 employees; 400M board feet daily.
47. Van DeNor Lbr. Co., Foot of Whipple St., Eureka; 42 employees; 70M board feet daily.
48. Van Vleet Wood Prod., St. Louis Rd & freeway North of Arcata; 60 employees; 125M board feet daily.
Most locations should be readily identifiable from street maps while others are available through the Humboldt County Assessors Office and other sources.
Contamination from the North Coast Railroad right-of-way that rings Humboldt Bay due to the degradation of dioxin-contaminated creosote and pentachlorophenol used in railroad ties and the probable use of dioxin-contaminated 2,4,5-T herbicide for vegetation control.
Thirty-two miles of track circle Humboldt Bay. Railroad ties discharge dioxin as they degrade in much the same way telephone poles are likely to discharge free and adsorbed dioxin (as described below); the surrounding ballast and soil contribute adsorbed dioxin to the Bay.
The assessment that the North Coast Railroad railway right-of-way discharges dioxin is drawn in part from descriptions of the condition of the right-of-way found in the following documents, all readily available to the Regional Board:
North Coast Railroad Authority Capital Assessment Report, Willdan/HNTB, 2002
Federal Emergency Management Agency. Region IX. Draft Environmental Assessment Restoration of the Northwestern Pacific Railroad, Humboldt, Trinity, and Mendocino Counties, URS Greiner Woodward Clyde Federal Services, January 2000
Assessment of the Current Business Position of the North Coast Railroad, The Woodside Consulting Group, August 1993
See also the references below regarding utility poles and railway rights-of-way. This information indicates that existing water quality standards are not likely to be met for Humboldt Bay.
Contamination from the discharge of pentachlorophenol laced with dioxin from thousands of utility poles that ring Humboldt Bay.
Several research articles and government reports indicate that dioxin is discharged from utility poles and/or railroad ties. This information indicates that existing water quality standards are not likely to be met for Humboldt Bay. Photographs of utility poles in a rainfall event with water discharging to a drain that goes directly to Humboldt Bay are available at http://alternatives2toxics.org/poisonpoles
[Regarding current sources of dioxin released into the environment by current practices] available data does, however, allow estimates of the amounts of dioxin-like compounds in bleached pulp (24 g TEQ/yr in 1995), POTW sludge used in fertilizers (7.0 g TEQ/yr in 1995), pentachlorophenol-treated wood (25,000 g TEQ/yr in 1995), dioxazine dyes and pigments (<1 g TEQ/yr in 1995) and 2,4-D (18.4 g TEQ/yr in 1995). Pg 2-9
Two of the largest potential reservoirs are soils and pentachlorophenol (PCP) treated wood. PCP contains low levels of CDD/CDFs and wood which has been treated with this pesticide represents a large reservoir of CDD/CDFs. CDD/CDFs may be released from the PCP-treated wood to the air by volatilization or to surrounding soils by leaching. Although hypothesized to occur, no reliable measurements have been made. Similarly, no empirical evidence exists on the possible magnitude of reservoir emissions from soil to air. Pg 2-10
From: U.S. Environmental Protection Agency, National Center for Environmental Assessment, Office of Research and Development.1998. The Inventory of Sources of Dioxin in the United Stateshttp://www.epa.gov/nceawww1/pdfs/dioxin/dioxin.pdf
The United States (US) Environmental Protection Agency (EPA) estimated that the use of technical grade pentachlorophenol (PCP) between 1970 and 1995 to treat wood was approximately 400 000 metric tons in the US, and that between 4800 and 36 000 g of 2,3,7,8-tetrachlorodibenzo-p-dioxin toxic equivalents (TEQs) were incorporated annually in treated wood. The EPA has been unable, however, to estimate the rate of release of polychlorinated dibenzo-p-dioxins and dibenzofurans (CDD/Fs) from treated utility poles into the environment. There is some evidence that CDD/Fs leach from treated poles into the surrounding soils, but these studies do not allow for the calculation of a rate of release from this mechanism. Another possible release mechanism is the volatilization of dioxins into the atmosphere, but there are no data to demonstrate, much less quantify, this release. While not directly measuring the release of dioxins from treated utility poles into the environment, this study was designed to examine the potential for such release. The general approach taken was to collect PCP-treated poles of varying ages, to remove and analyze multiple samples from each pole cross-section, and to compare the spatial distribution of CDD/F congeners among poles of different ages. Evidence of concentrationdepth profile changes over time may provide insight into the potential for dioxins to migrate through and then out of PCP- treated utility poles. It was found that the CDD/F concentrations were consistently higher in the outer portions of the poles than the center. This trend tends to be most marked in older poles and for the lower chlorinated congeners. The trend for dioxins to concentrate in the outer portions of the pole over time suggest migration within the poles, and this migration may result in some environmental release. Other possible explanations were also offered.
From: Lorber, M. et al. U.S. Environmental Agency. 2002. Investigation of the potential release of polychlorinated dioxins and furans from PCP-treated utility poles Sci Total Env 290:1-3 (15-39)
The Agency for Toxic Substances and Disease Registry reports in its Toxicological Profile for Chlorinated Dibenzo-p-dioxins (update) 1998 http://www.atsdr.cdc.gov/toxprofiles/tp104.html reports (page441) that
Utility telecommunication and railway right-of-ways may be contaminated by leaching of CDDs associated with chlorophenol-treated railway ties and utility poles. A study in British Columbia showed that CDDs and CDFs were not detected in parkland ditch sediments (control), but were detected in farmland, utility and railway right-of-way ditch sediments (Wan and van Oostdam 1995)
Wan, M. T.; Oostdam, J. van 1995. Journal of Environmental Quality 24(2): 257-265. Utility and railway rights-of-way contaminants: dioxins and furans.
Other supporting documentation is available in the Agency for Toxic Substances and Disease Registrys 2001 Toxicological Profile for Pentachlorophenol (Update) http://www.atsdr.cdc.gov/toxprofiles/tp51.html
We believe the information presented above is sufficient to support a 303(d) listing of Humboldt Bay for dioxin impairment due to the overwhelming evidence that reservoir sources of dioxin are contributing CDDs and CDFs to Humboldt Bay. That empirical data supports this information is proof enough that this listing should be extended until these sources are removed and discharges are negligible.
Sincerely,
Patricia Clary
Programs Director
Californians for Alternatives to Toxics
315 P Street
Eureka, CA 95501
707-445-5100
patty@alternatives2toxics.org